
Hope for Health Equity (Part I): Addressing Disparities in Type 2 Diabetes Care


This is Part I of a three part series on health equity. Our series continues with an exploration of Virta patient outcomes in Part II: Outcomes by Socioeconomic Status and Part III: Outcomes by Race and Ethnicity.
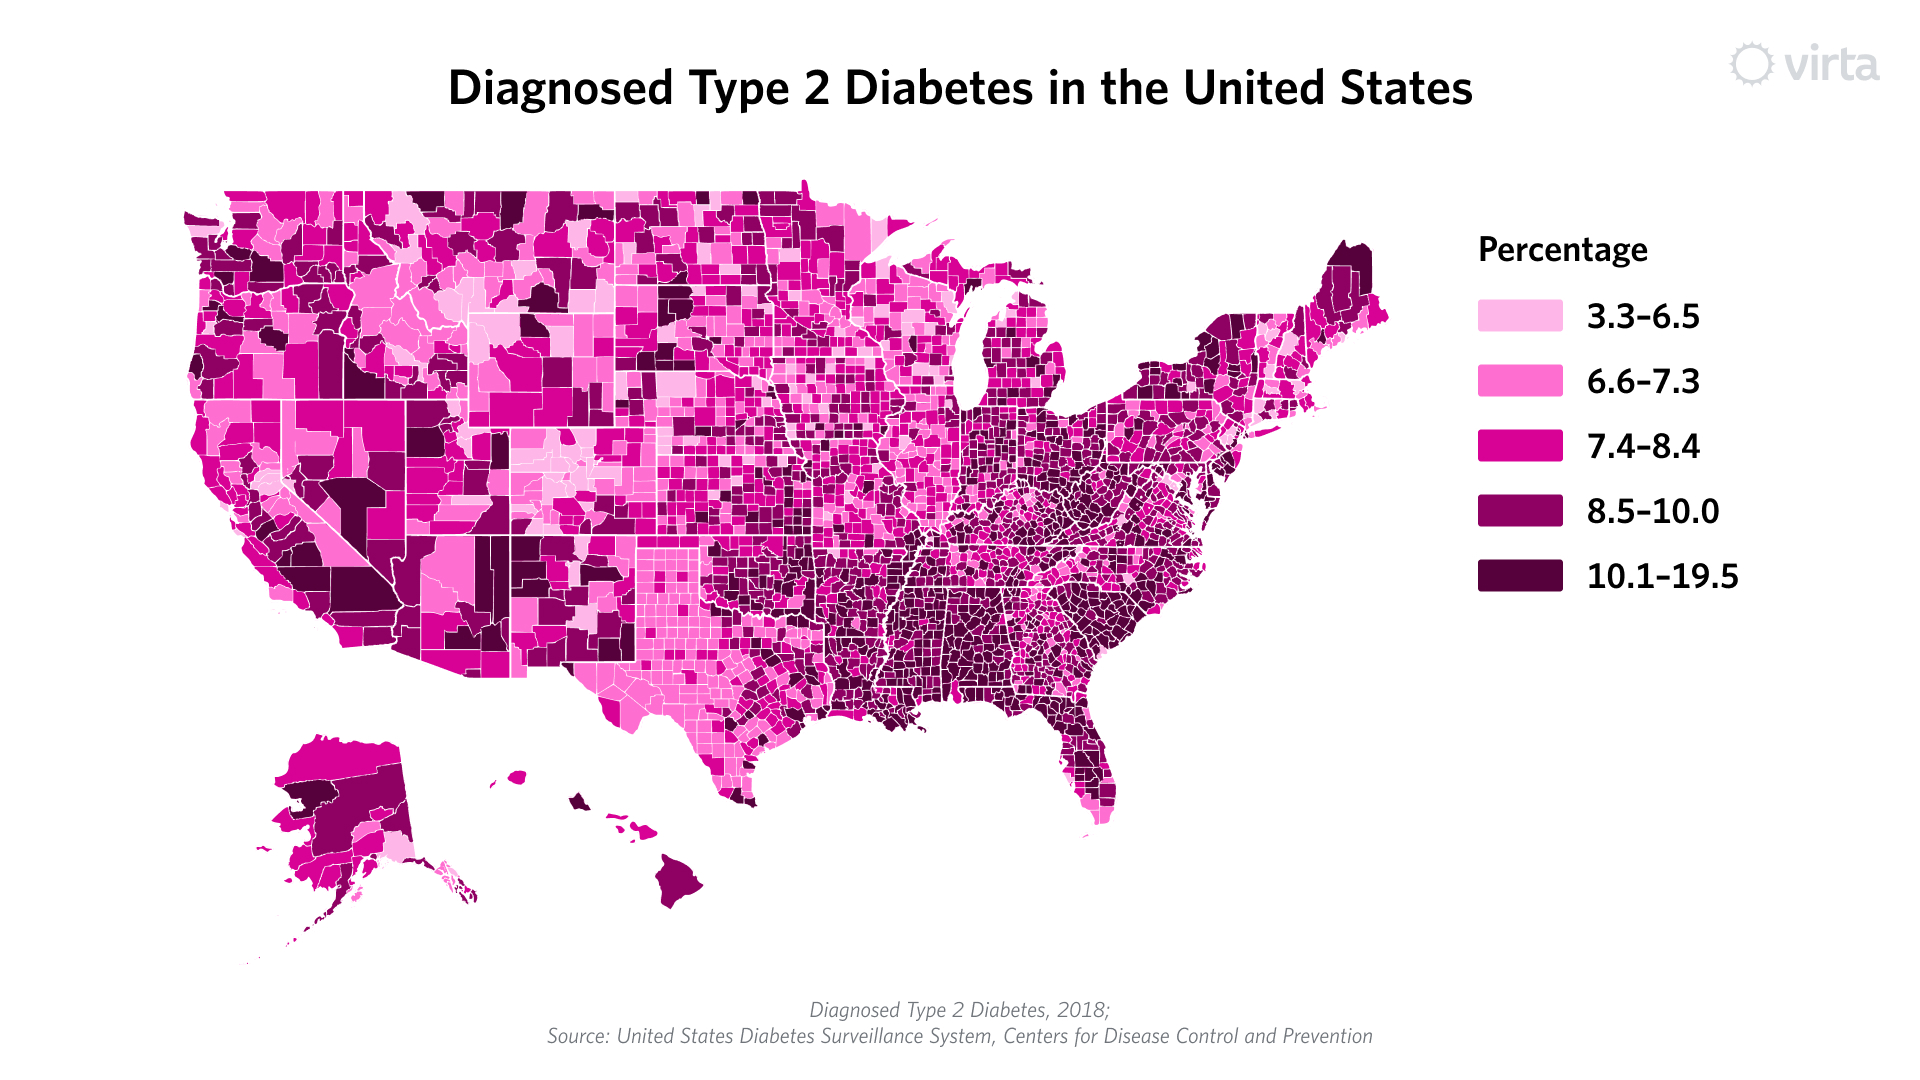
Nowhere are health equity issues more apparent than in type 2 diabetes, obesity, and metabolic health. For those in disadvantaged communities, and for certain racial and ethnic minority groups (in particular Black, Native American, Hispanic, and Pacific Islander populations), rates of diabetes far surpass the national average. These populations are also more likely to be on medications to manage their diabetes, and to experience worse outcomes, including death or severe complications such as amputation and blindness.
One of the clearest examples of current disparities is in the Deep South, where rates of type 2 diabetes are among the highest in the U.S. and many of the hardest-hit communities are Black and low-income. In one zip code in South Carolina, for example, amputation rates are nearly 40 times greater than other Deep South communities. Stunningly, on a national basis, 52-80% of patients who receive a lower-leg amputation will die within five years. This is horrifying and has to stop.
Social determinants of health—factors that include access to food, housing, education and healthcare—play a key role in these disparities. Lack of access to healthy and affordable foods can increase the likelihood of developing type 2 diabetes. Lack of access to quality healthcare might mean that diabetes progression accelerates to an uncontrolled state, which increases the chances of catastrophic outcomes, including preventable disability and death.
This then begs the question: what is the healthcare industry doing about this? To fix the problem first requires being able to measure and understand it. Clinical trial data may identify the number of patients by race and ethnicity subgroups, but the outcomes by subgroup are not always reported, which can mask important differences and hide disparities. Further, those who have measured outcomes by population sub-groups seem reluctant to publish such data.
Until now, that included Virta. This year, we initiated an effort to more deeply understand how Virta affects patients from different backgrounds. Specifically, we looked at outcomes by Area Deprivation Index to approximate socioeconomic conditions of the area in which one lives and by self-reported race and ethnicity. We’ve decided to share this data, in part because we are excited about the results, but also because we believe there is much we and others can learn from it. Moreover, it presents opportunities for us all to better understand how to do even more to mitigate the effects of this devastating condition.
In observance of National Diabetes Awareness Month, we’ll share what we are seeing in our patient population, and we encourage other diabetes-focused providers to do the same. In doing so, we'll uncover both what's working well and where we need to improve. We are early in our health equity journey, but by sharing an early look at our data, we hope to start a discussion on how to accelerate the delivery of world-class metabolic health care to everyone who needs it.
Our series continues with an exploration of Virta patient outcomes in Part II: Outcomes by Socioeconomic Status and Part III: Outcomes by Race and Ethnicity.
Learn more about Virta's health equity work here. Watch a replay of our recent webinar on Closing Health Equity Gaps in diabetes care, which includes a deep dive on Virta's Health Equity Research Study.
This blog is intended for informational purposes only and is not meant to be a substitute for professional medical advice, diagnosis, or treatment. Always seek the advice of your physician or other qualified health provider with any questions you may have regarding a medical condition or any advice relating to your health. View full disclaimer
Are you living with type 2 diabetes, prediabetes, or unwanted weight?


.jpg)